Calculation Flow
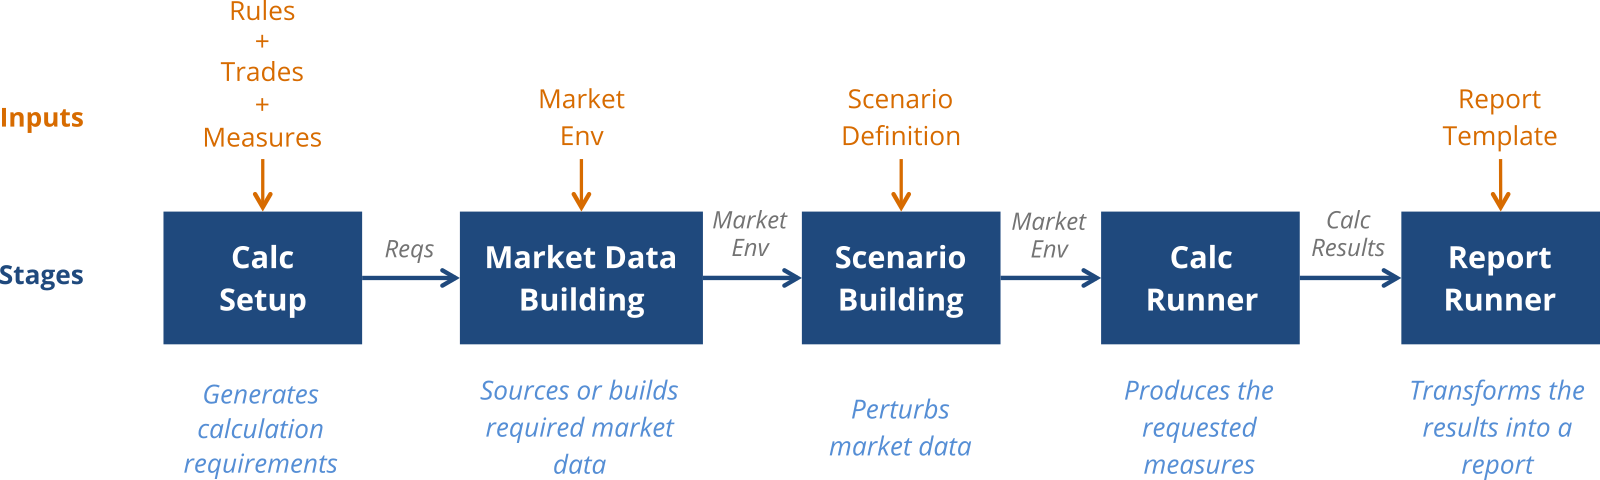
Strata’s functionality is built around a well-defined calculation flow, with stages that each serve one purpose. This is a key mechanism for achieving a separation of concerns between different parts of Strata, and ensuring that calculations fail fast.
The stages can be accessed and run individually, perhaps persisting the output to feed into the next stage for later use, or they can be run sequentially through APIs that abstract across multiple stages.
Calculation setup
At its core, Strata calculations operate on a list of trades, a list of columns and some rules. The setup stage primarily involves choosing the columns and defining the calculation rules.
Each column is normally a thin wrapper around the risk measure to be calculated, such as present value or par rate. When necessary, the column can also contain overrides to the default set of calculation rules.
The calculation rules have three parts:
- pricing rules - select the appropriate function to invoke
- reporting currency - select the currency to convert to
- parameters - select the market data to use
The final part of setup is creating a suitable set of market data. In many cases, the market data is known and can simply be assembled.
Where the market data is not known, Strata offers the option of using the calculation functions
to determine the data that is required for a specific set of trades, columns and rules.
To achieve this, create an instance of CalculationTasks and call requirements(ReferenceData).
These requirements allow the market data to be built in the next stage.
Market data building
The second stage takes the market data requirements and attempts to build a market data for the requirements.
After this stage, no more market data needs to be sourced for the calculations to be executed. It may be useful to inspect the results of this stage in advance of a long-running calculation job to check for market data errors before executing the calculations.
See market data building for more details.
Scenario building
This optional stage allows the market environment built in the previous stage to be used as the basis for applying one or more sets of perturbations.
Building the market data for the scenarios up-front is a key part of allowing vector-based calculations. It also means that, going into the next stage, all necessary data has already been sourced or built, so the calculations can proceed as quickly as possible.
The scenarios are specified by the scenario definition input which describes the perturbations to be applied. See market data building for more details.
Calculation runner
This stage runs the calculations necessary to produce the measures originally requested. It is invoked with the market data that was previously built.
Since the market data is passed into this stage, it is possible to examine and modify the data before invoking the calculations. This allows the application to ensure that calculations are only invoked once all the market data is available.
The output is the set of calculation results. This a table containing the input trades as the rows and the requested measures as the columns.
If the calculation involved scenarios, each cell in the grid of results will contain an array of values, one for each scenario.
This stage is implemented by the CalculationRunner component.
Report runner
The final, optional stage allows the calculation results to be transformed into a report. This transformation is driven by an input report template.
While the set of calculation results are provided as a simple table structure at a trade level, the calculated values in the ‘cells’ are often not directly suitable for reporting even at this same trade level. For example, a value corresponding to a curve sensitivity measure in a multi-curve environment may contain the sensitivities to every curve in a nested data structure, or if multiple scenarios are present then each ‘cell’ will contain a result for each scenario in a list.
A report is a user-facing table structure, designed for a particular purpose, which is suitable for backing a grid in a UI, or for rendering directly as text or CSV.
The report runner extracts the necessary information from the input calculation results and outputs the report defined by the report template.
This stage is implemented by ReportRunner in the method runReport.